Anomaly Detection Project: Completion!
Recently, I had the pleasure of being part of the team that submitted our results and working prototypes for the “AI for Decision-Making” (Stage 1 Phase 2) project proposed by the Defence Innovation Network, a University-Defence lead iniative to provide funding for projects with relevance to Australian Defence.
You can find our work, with demonstrations, in our repository. We also wrote up a series of blog posts, aimed at introducing people to our work without getting overly technical. You can find this hosted here.
In the future, I will write up my learnings from this project and on anomaly detection as a whole, to both remember and showcase the work we had done and how it might be applied and extended. Stay tuned!
Images
Some cool images from our work!
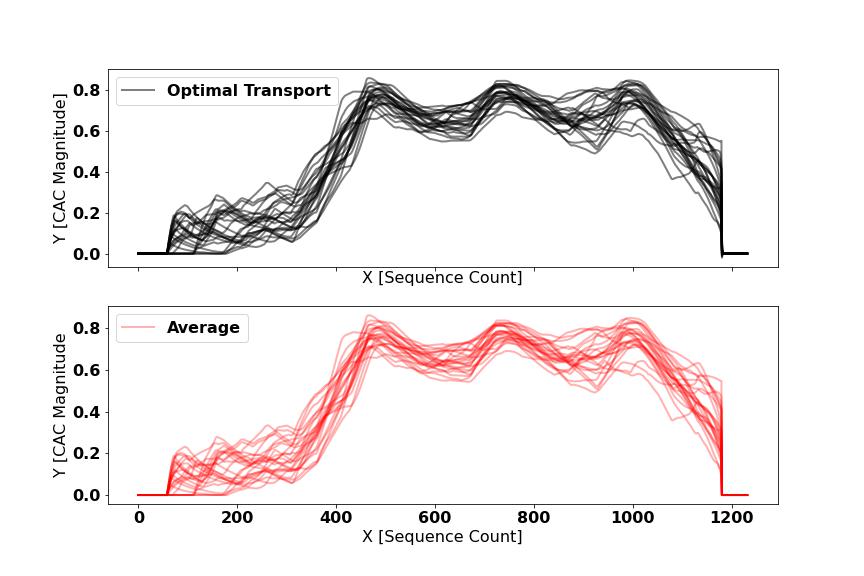 Figure 1: With the appropriate data transformations, we can convert incoming time series signals from a sensor array into an anomaly predictor, with each sensor producing each one of these curves. The peaks of the curves correspond to likely anomalous transitions.
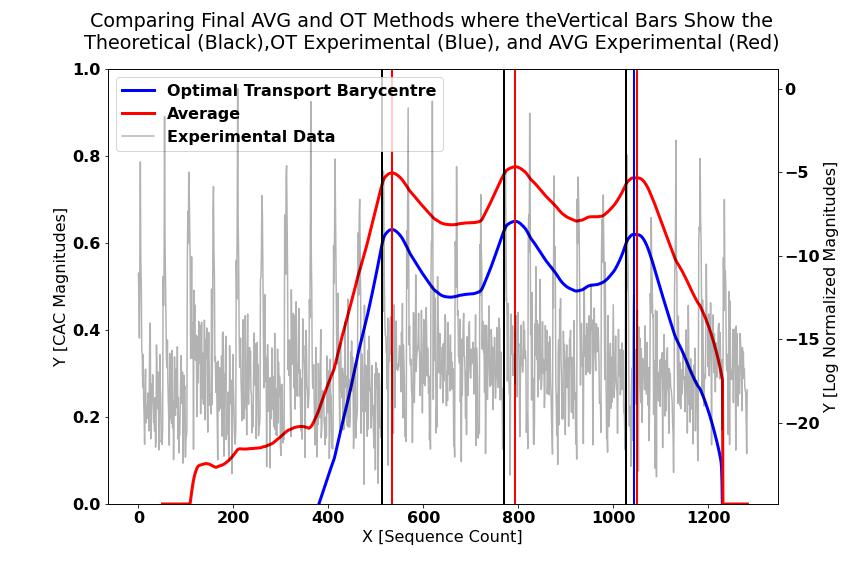
Figure 2: By leveraging multiple sources of data (in our experiments, 24 sensors worth of data), we can use data averaging techniques to combine the information effectively and obtain a smooth anomaly predictor that is robust against noise.
 Figure 3: We generalised our methods to work in real time by transforming sensor data in batches as it arrives. Peaks correspond to detected anomalies. Red lines correspond to the theoretical positions where an anomalous transition has taken place.